 Agile Effectiveness Dashboard · Intralinks Portal
Making dense data usable for Bank of America engineering and security teams
At Bank of America, I designed two internal tools: an Agile Effectiveness Dashboard, built from scratch for an engineering director and the team leads who run his developer pods, and a branded portal for Intralinks, the virtual data room the bank uses to share encrypted files with outside parties.
Results
- 30%less time for leaders to interpret team data
- 40%faster task completion in Intralinks user testing
The Challenge
The engineering director and his team leads tracked their pods in a Tableau report that was essentially a giant pivot table: rows and rows of data, and no one to explain it. They needed to see quickly how each team was doing, so they could allocate work, watch velocity, and catch gaps early.
Separately, Intralinks is a third-party virtual data room. Each “exchange” is a secure, encrypted workspace for sharing sensitive files with outside parties. Administrators, compliance, IT and security, and help desk staff needed one Bank of America–branded place to manage exchanges, control who has access, and run reports, within what the vendor platform allowed.
What I Solved
01From a giant pivot table to a story at a glance
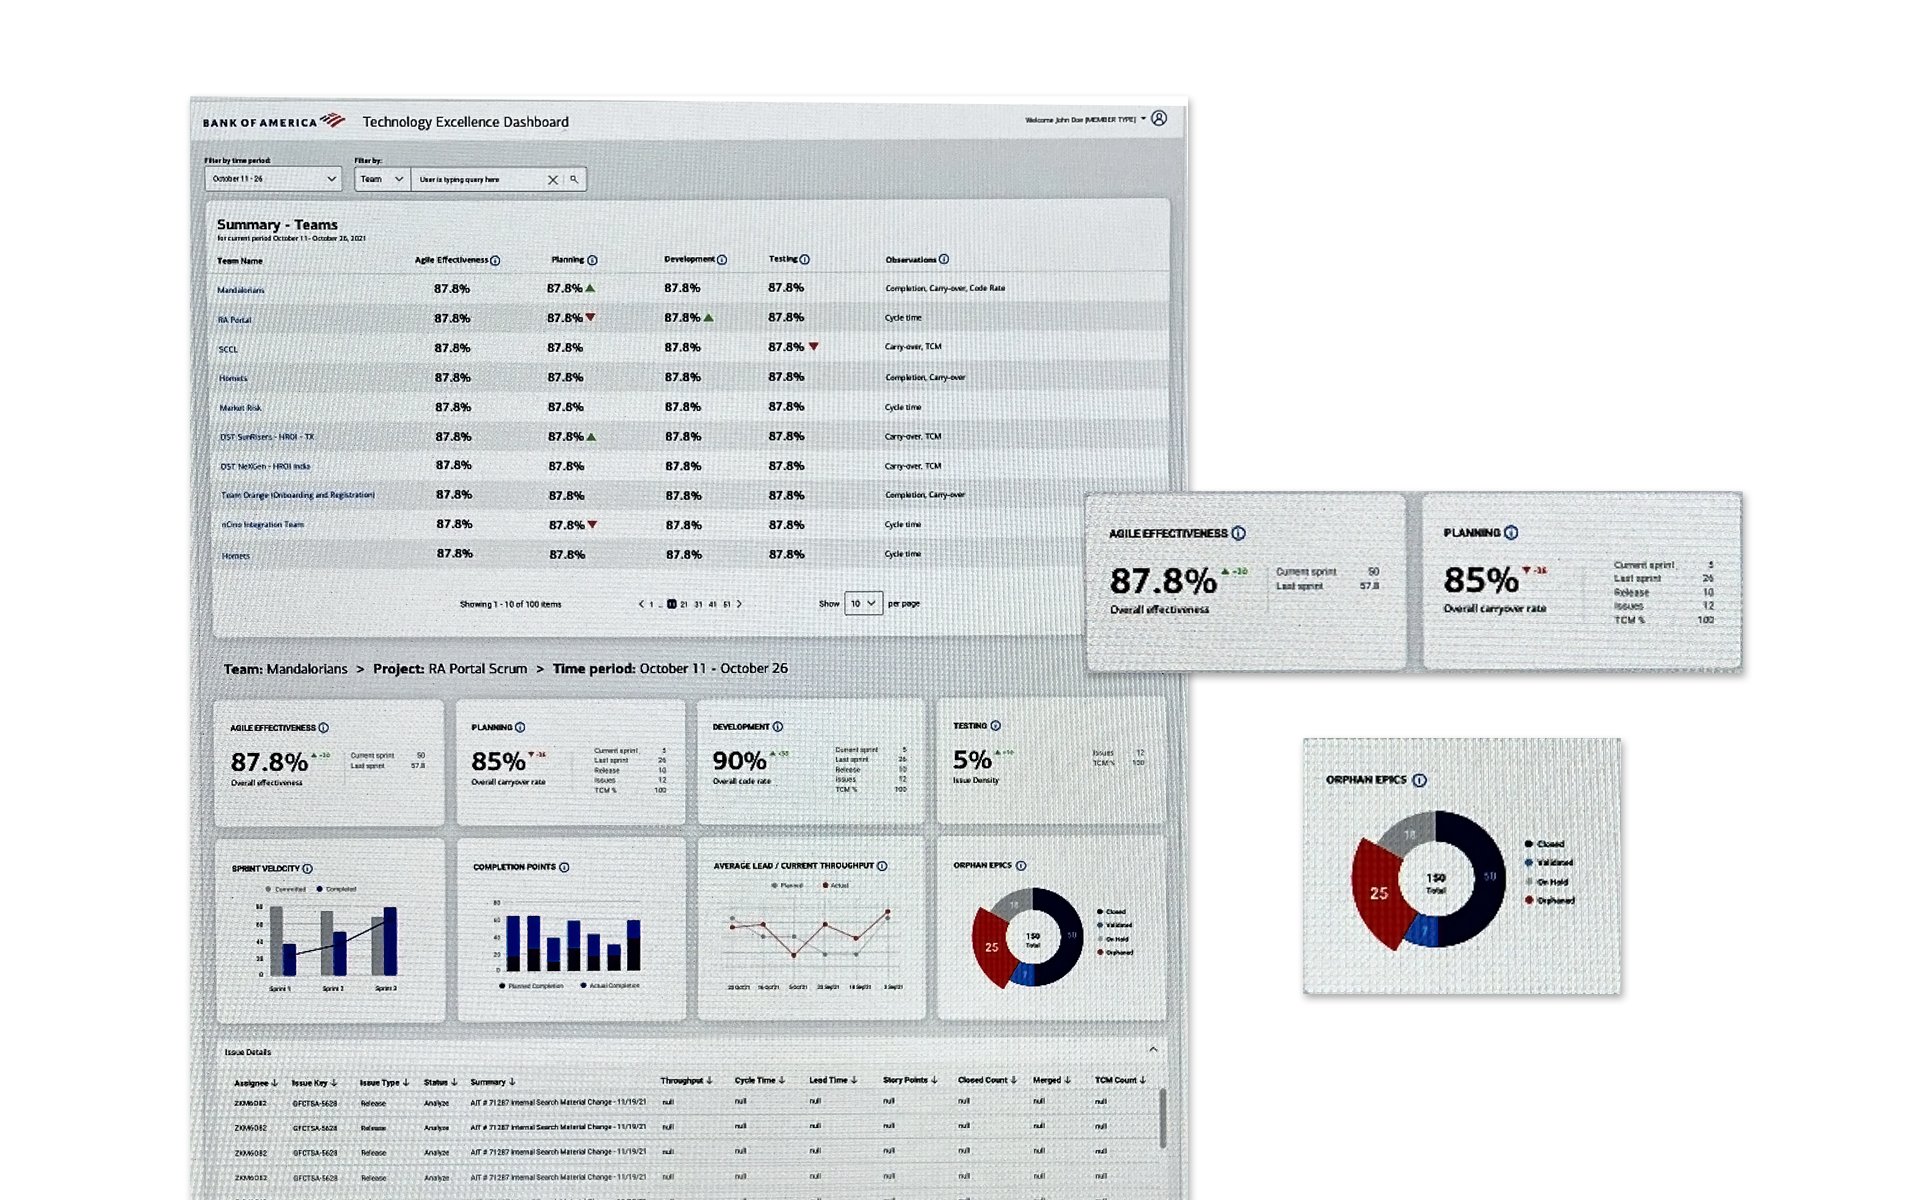
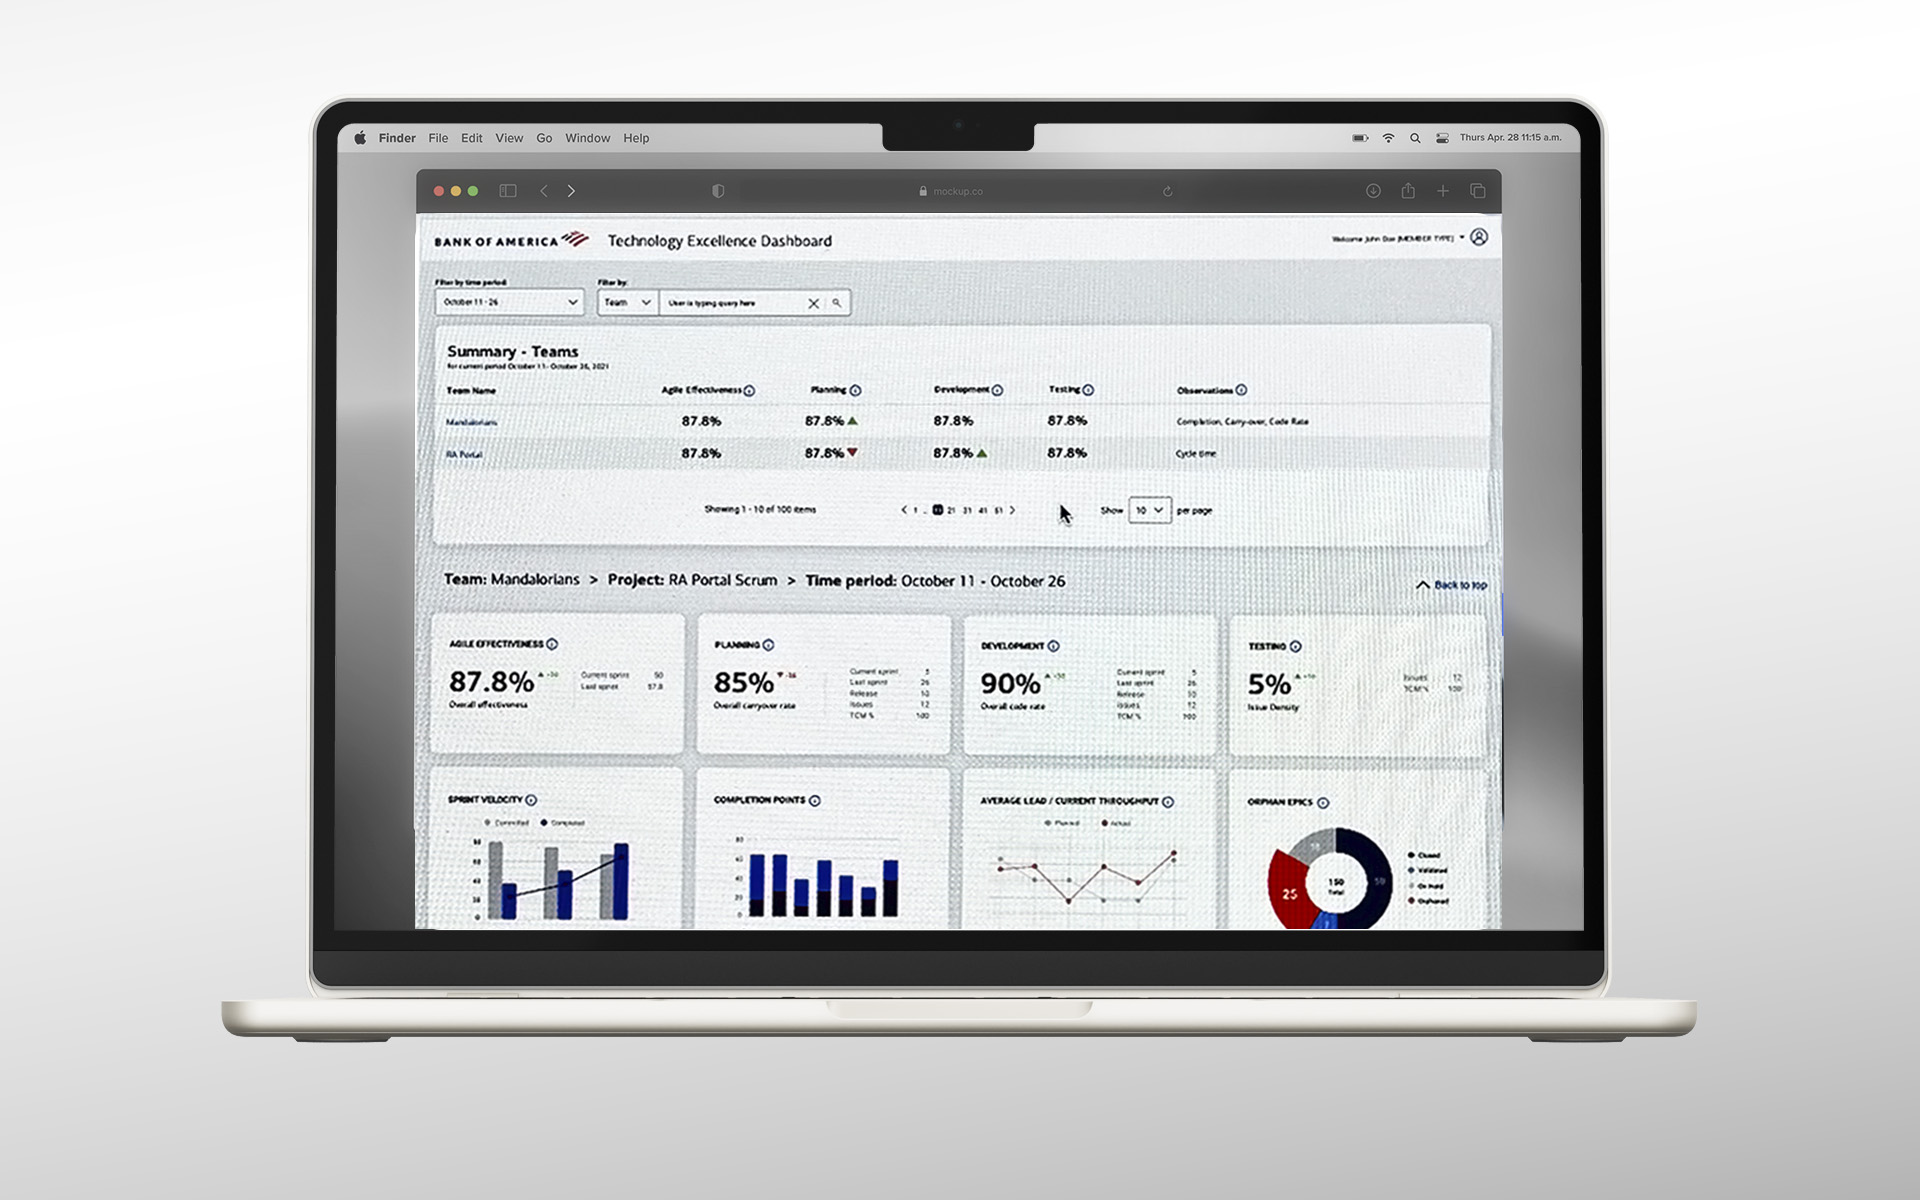
With no one to walk me through the data, I had to work out what an agile effectiveness dashboard should be. I presented designs to the director and team leads, iterated on their feedback, and kept going until we reached the final design. It leads with each team’s scores for agile effectiveness, planning, development, and testing, with arrows showing which way each is trending. Select a team to see sprint velocity, completion points, throughput, and orphan epics, each as a chart that tells its part of the story quickly.
02Designing Intralinks around each role
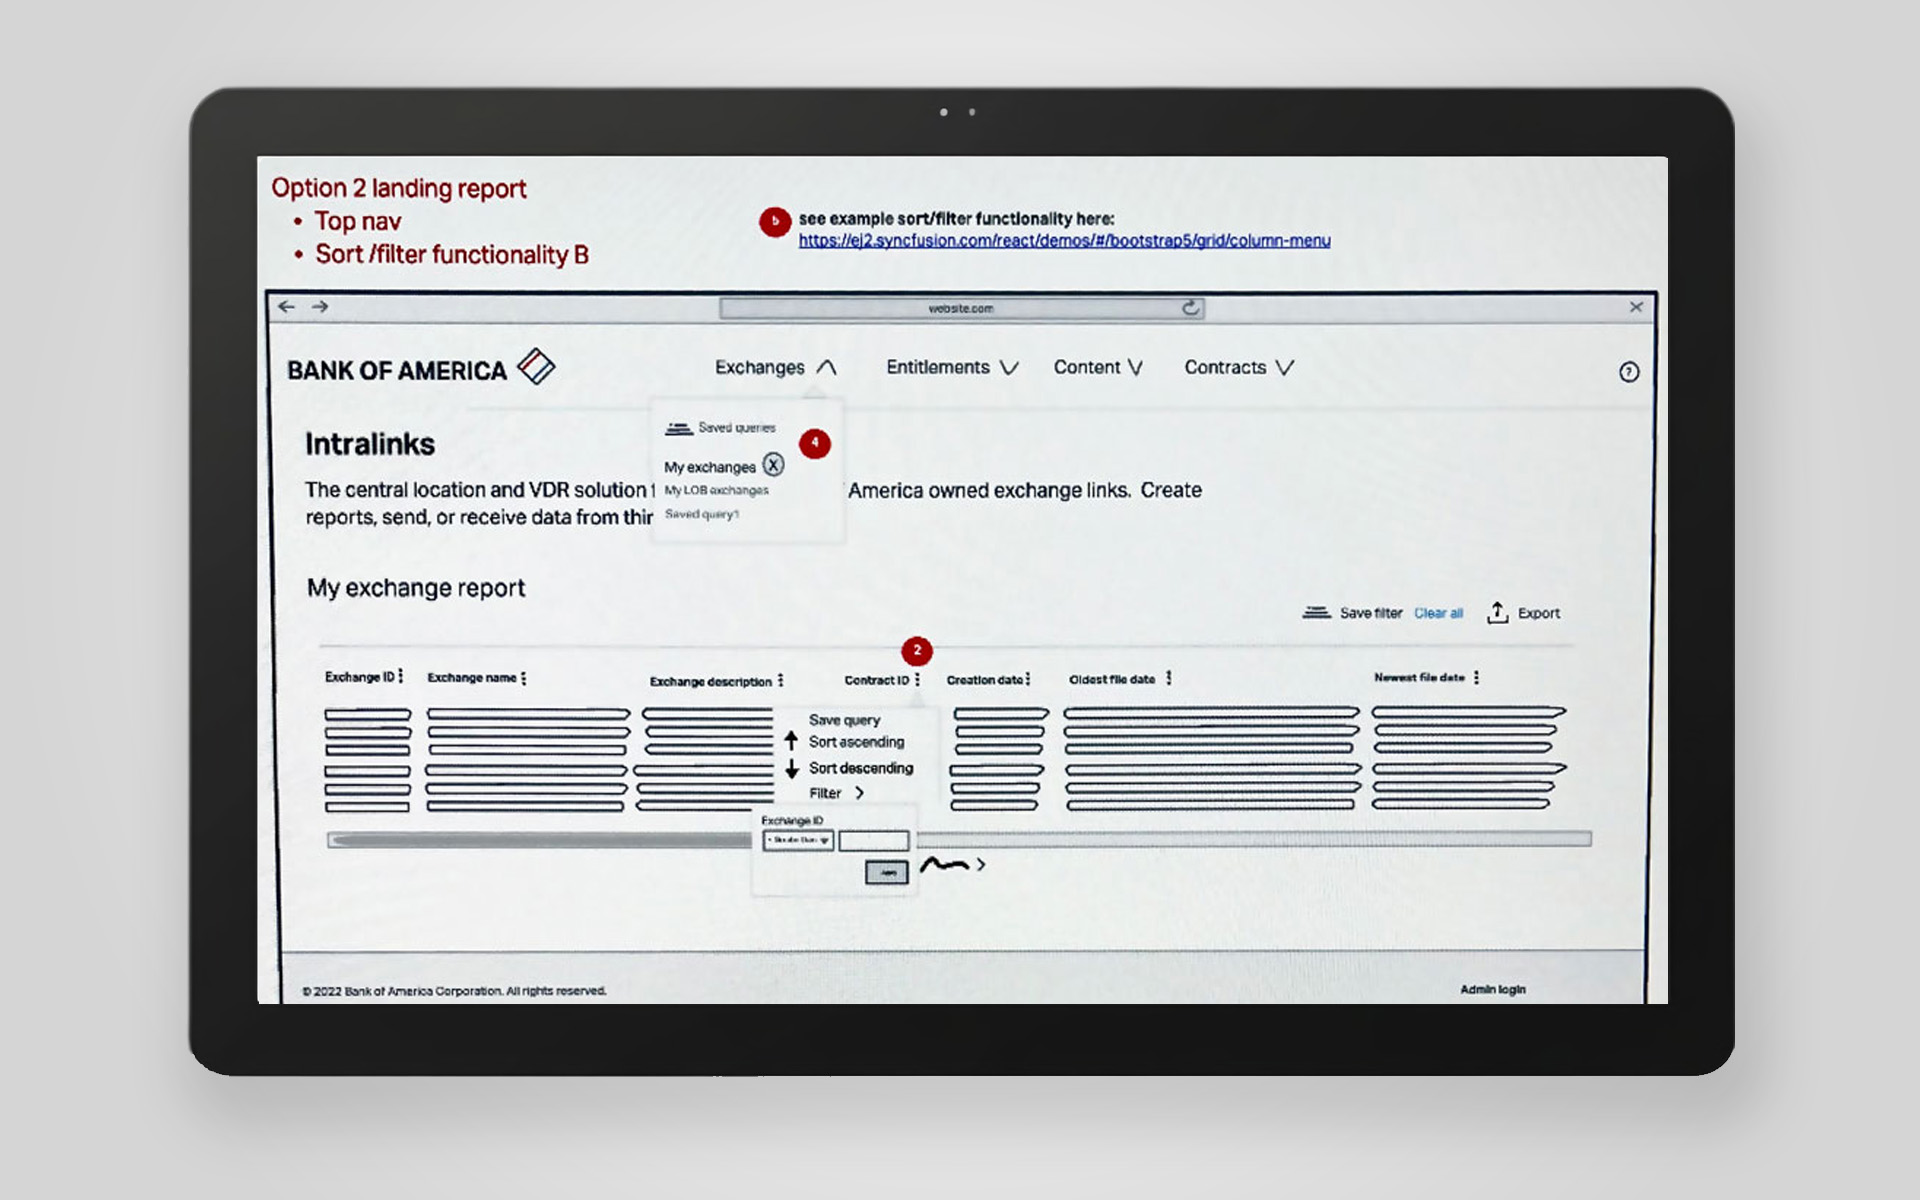
I gathered requirements and pain points from the product owner, subject matter experts, and the staff who used Intralinks every day. I mapped jobs to be done for each role, compared leading virtual data room platforms, and reviewed options with the dev lead for feasibility before committing to a direction.
03One branded portal, inside the vendor’s limits
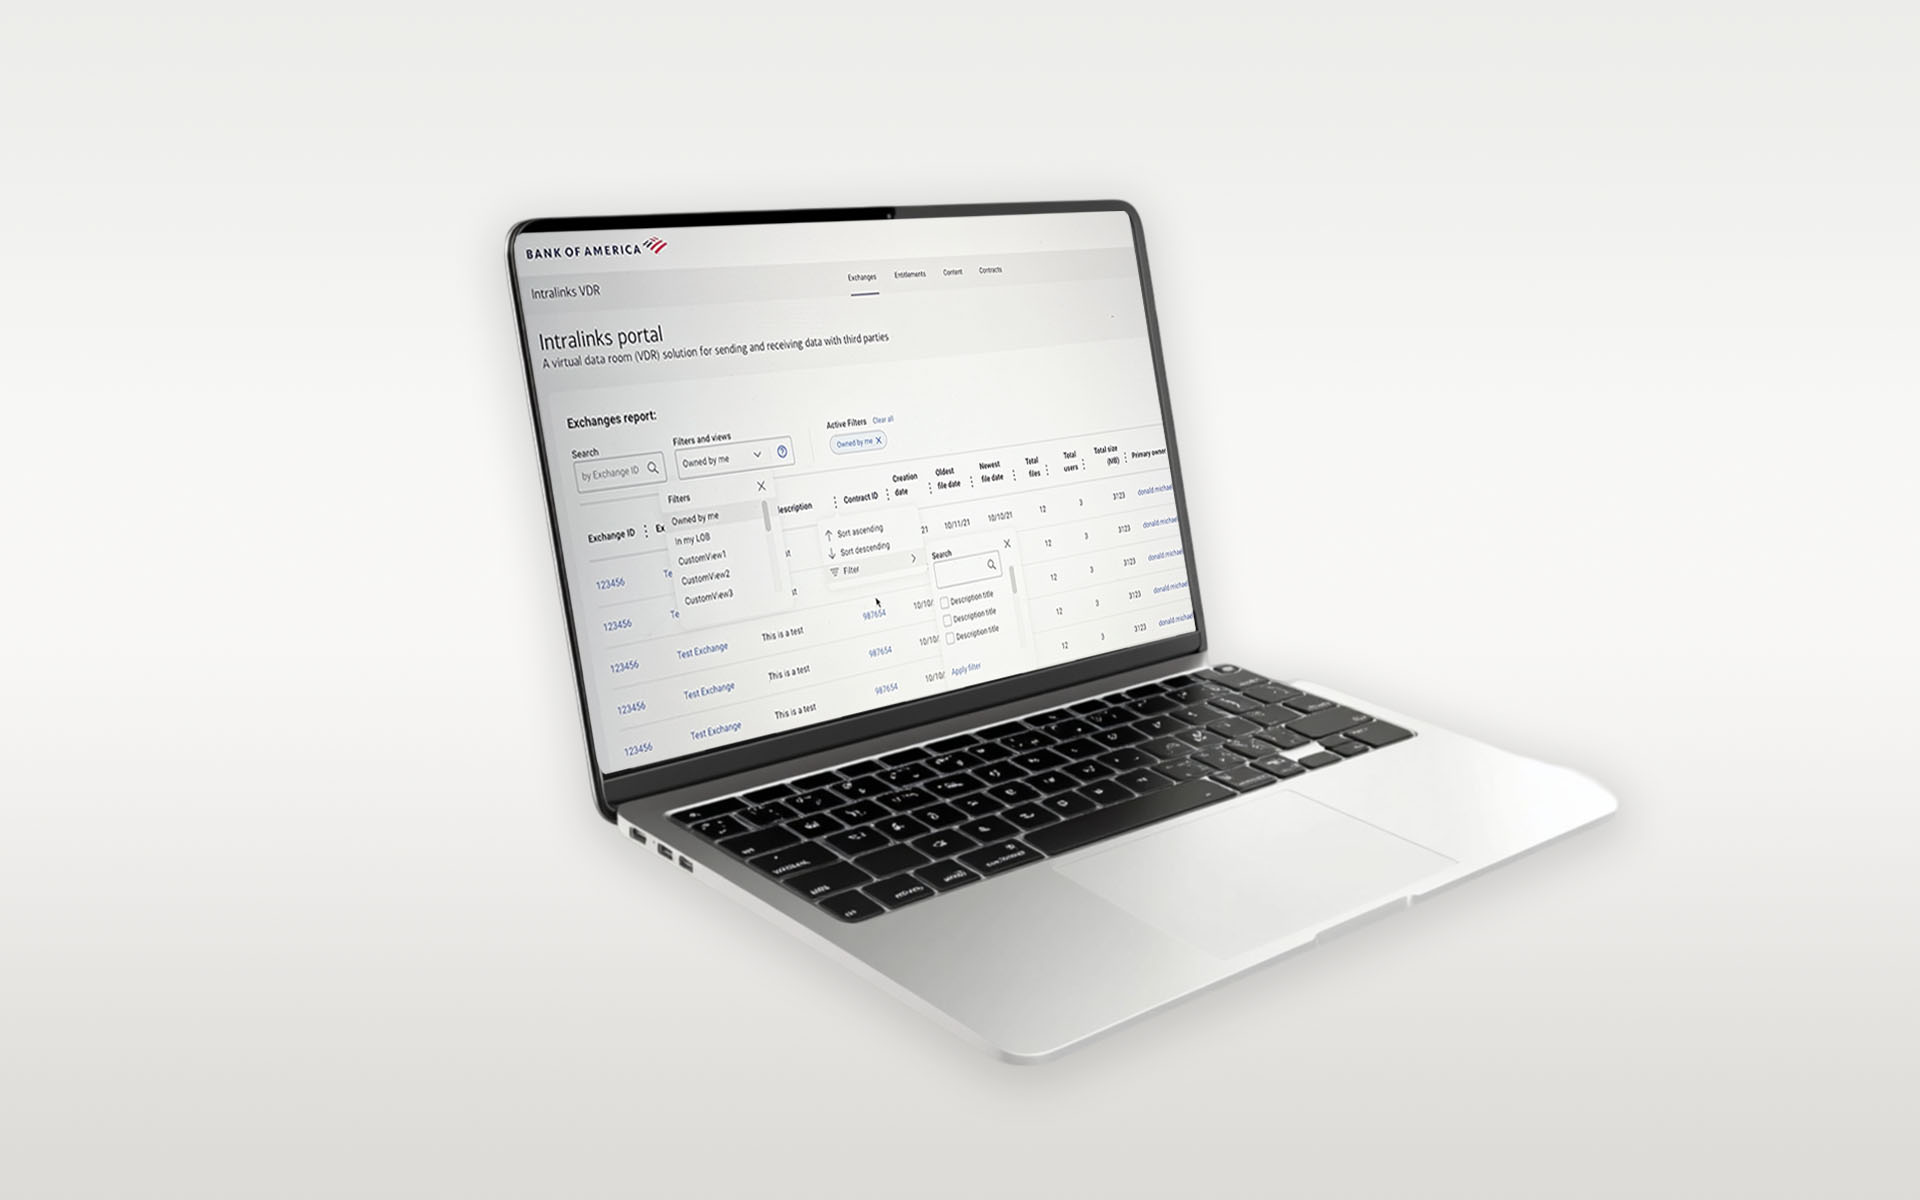
The portal puts exchanges, entitlements, content, and contracts under one Bank of America navigation. The exchanges report adds search, saved views such as “Owned by me” and “In my LOB,” and sorting and filtering on every column. In user testing, teams completed tasks 40% faster.
Let's Create Something
Together